Loading...
Diabetes is a chronic disease whose prevalence has increased rapidly in the past few decades. According to the report from WHO, in 2014, the prevalence of diabetes among adult population had risen from 4.7% to 8.5% comparing to that in 1980 (WHO, 2016).
In 2015, 7.2% of the United States population are diagnosed with Diabetes (CDC, 2017). Previous studies identified obesity as the main risk factor of type 2 diabetes (which account for 95% cases of diabetes in the U.S. (Smyth & Heron, 2006). The report from the CDC also demonstrates that there are certain association between socioeconomic status and diabetes prevalence (CDC, 2017).
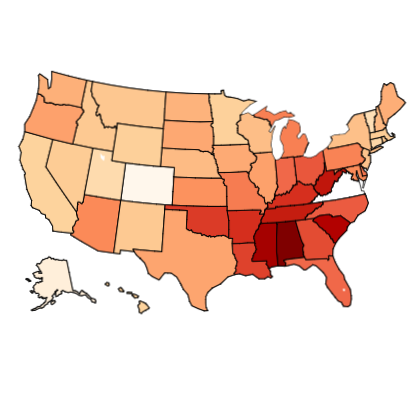
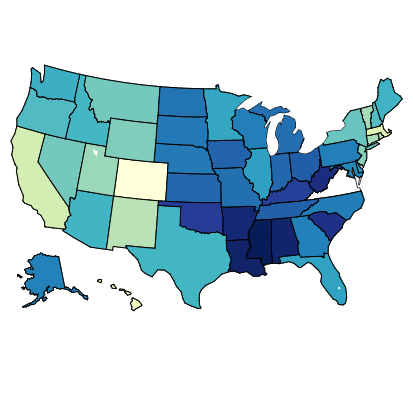
Inspiring by these findings which are all somehow related to food environment, we set the goal to explore the association between prevalence of diabetes in United States and food related factors, including median household income, fast-food restaurants availability, participation proportion of National School Lunch Program (NSLP)/School Breakfast Program (SBP), average number of supermarket and grocery stores/1,000 residents etc. The research focused on population scale where we explore the relationship between stately diabetes rate and multiple factors of the state.
The main dataset we use is Food Environment Atlas. The dataset contains several spreadsheets which provide information on population characteristics and food factors of each state at the county level, which are later averaged to be at state level.
In addition to this main dataset, we also use another four datasets: two for median household income(2008 and 2013) from census.gov, and two for disbetes rate(2009 and 2014) found on United States Diabetes Surveillance System.
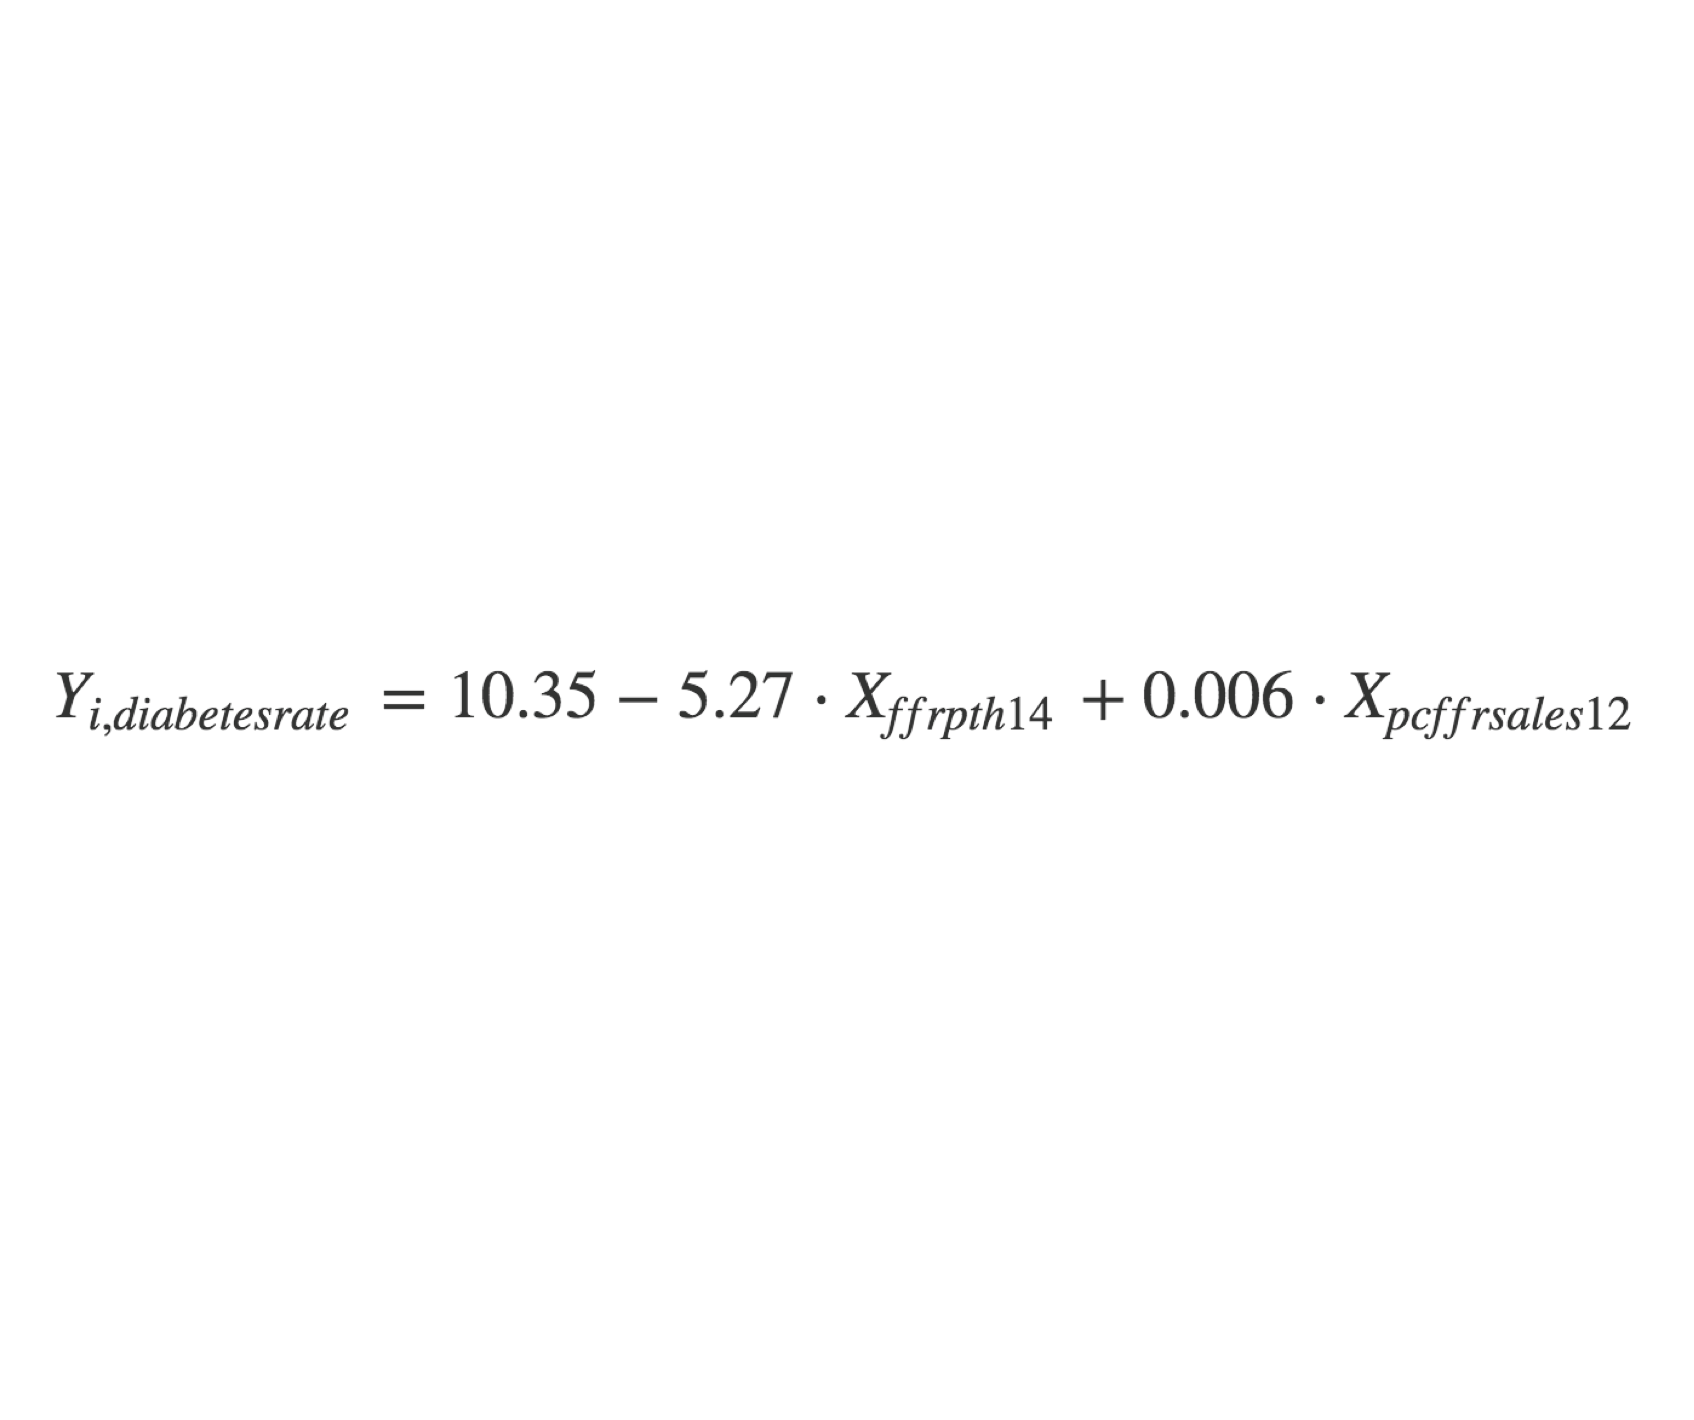
The final explanatory model is:
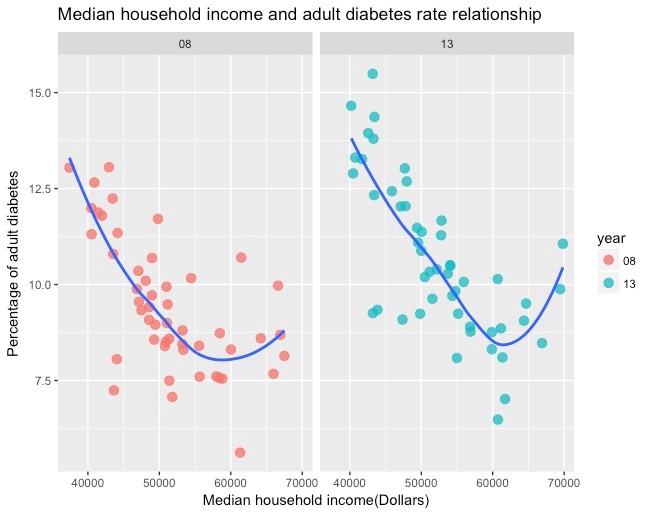
When the median household income is below 60,000 dollars, there is a strong negative linear relationship. When the median household income is above 60,000 dollars, there is an increasing trend, but no statistically significant linear relationship.
There is significant but not strong linear relationship between the number of Fast-food restaurants per 1,000 people and U.S. adult diabetes rate adjusted for expenditures per capita of fast food.
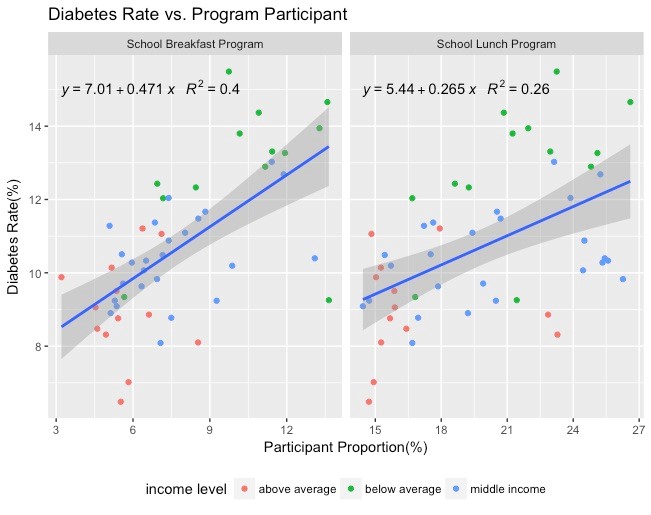
There is a positive linear relationship between diabetes rate / School Breakfast Program and National School Lunch Program.
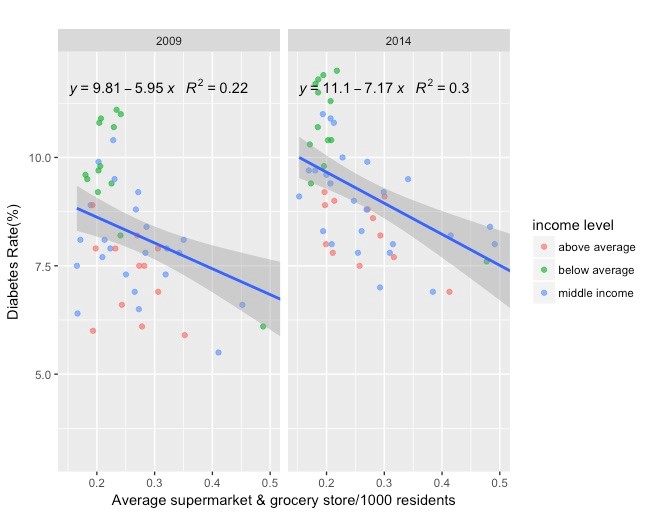
There is a negative linear relationship between diabetes rate and average number of supermarket & grocery stores/1000 residents
This project explore the linear association between several food environment related factors and U.S. adult diabetes rate. Some results, including the relationship between obesity and diabetes, and the relationship between socioeconomic status and diabetes, are consistent with previous studies. Based on the result after exploring the one by one relationship between adult diabetes rate in the U.S. and each food environment related variable, a final explanatory linear model is built to capture the relationship between food environment factors and U.S. adult diabetes rate.
However, the project mainly focused on linear relationship, which means non-linear relationship cannot be well captured. The final model we constructed is not a prediction model, but an explanatory model. This means we cannot use food environment factors to predict the U.S. adult diabetes rate.
Moreover, since we did the analysis at the state level, explained by the flexdashboard, some meaningful pattern at county level may be diluted as we simply even the variable among all the counties without considering the population in each county. With higher quality data, further study could be conducted to build a more complex model to achieve the goal of prediction.